
In the consumer loyalty and brand health metrics history, we have seen the evolution of “Best Practices”.
In the beginning, the ultimate question was something like “Based on your recent transaction, how satisfied are you with our company?” This was usually scored on a scale of 1 to 5. Some companies would then ask the respondent why they felt that way or would drill down into specific aspects of the transaction.
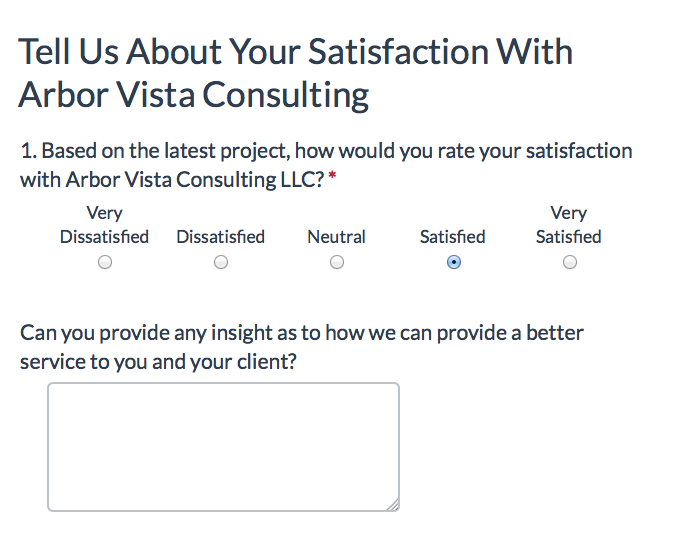
Here is an example of a basic satisfaction question.
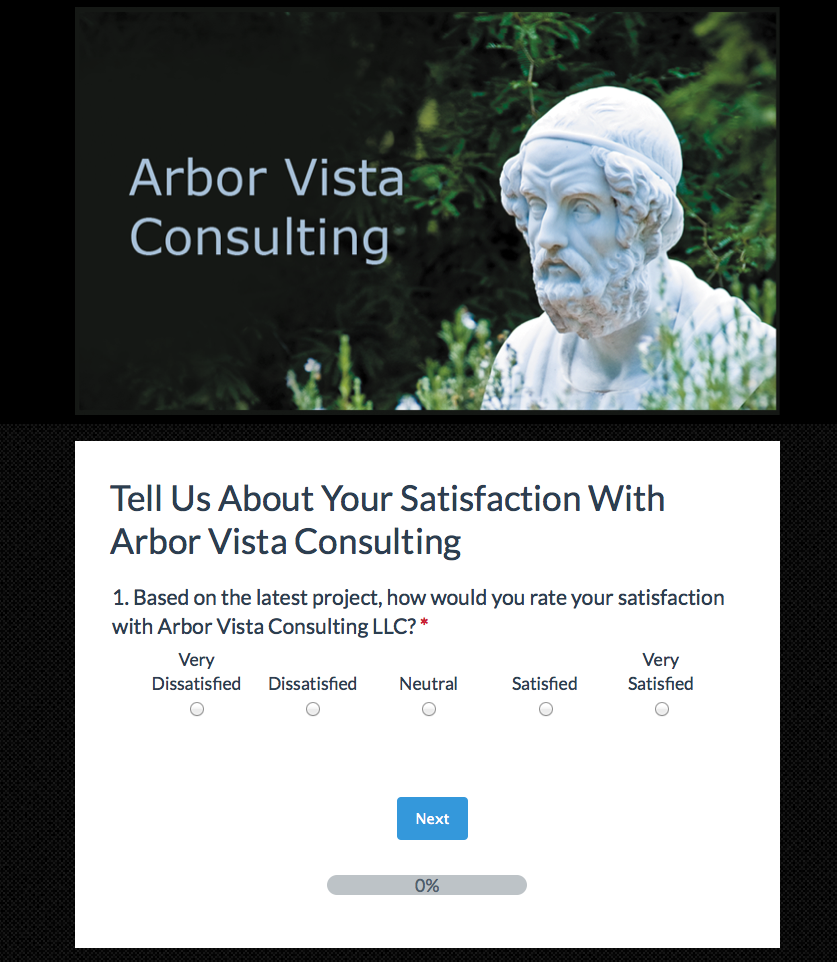
As you will note we have designed this survey to only show the comment box on how we could improve if the respondent chose any option other than Very Satisfied.
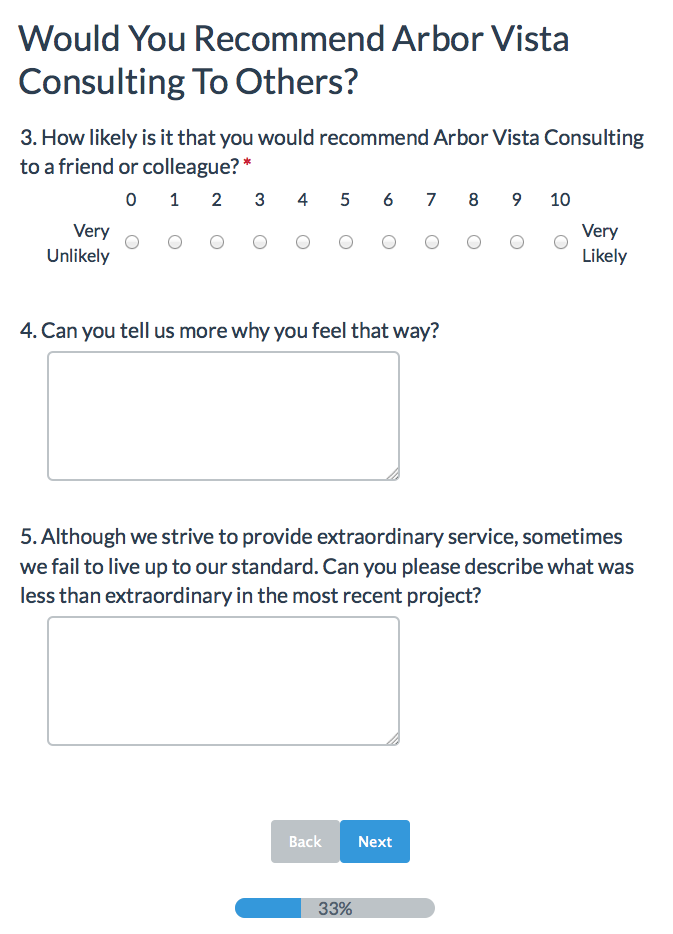
Then almost a decade ago, the Net Promoter Score® (NPS) was announced. NPS revolved around a simple albeit actionable question “How likely is it that you would recommend Company X [or Product X] to a friend or colleague?” The NPS question is almost always scored on a 0 to 10 scale with 0 to 6 scores classified as detractors, 7 and 8 scores as passives and 9 or 10 scores as promoters.
Next on the evolution of the NPS concept was to ask the question “Why”. This open ended verbatim question allowed companies to analyze the root cause of problems facing customer loyalty.
Here is an example of a Net Promoter Question.
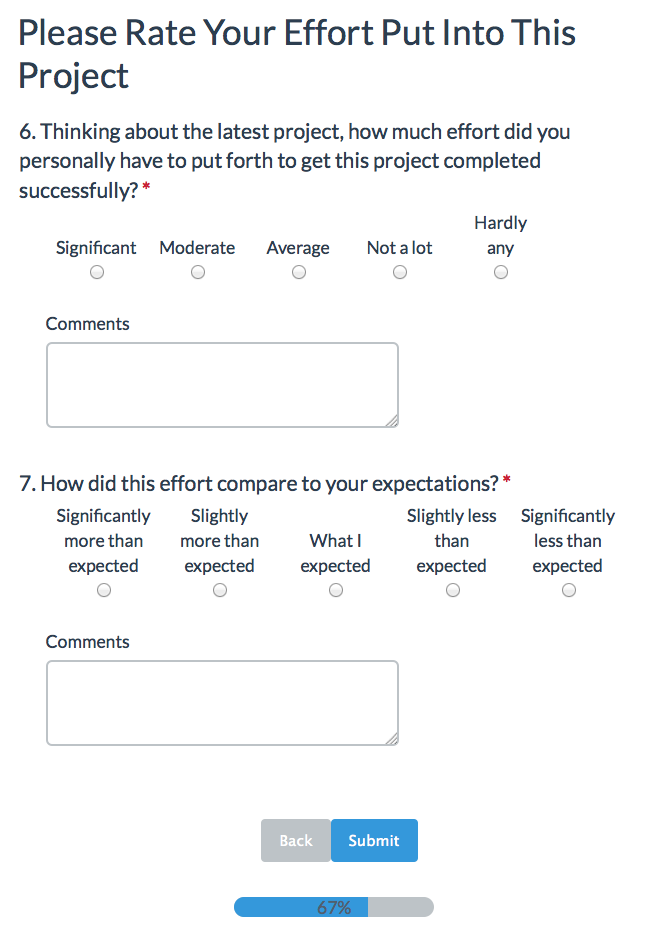
Now we are discovering a third useful metric for determining consumer loyalty, which is the Customer Effort Score (CES). The concept of CES revolves around one question “How much effort did you personally have to put forth to handle your purchase?” This question usually calls for a five point scale. There can be a follow on question also used which asks “How did this effort compare to your expectations?” The purpose of the second question is to compare the consumer’s actual effort against what they expected the transaction to take.
Here is an example of a Customer Effort Score question layout:
At Arbor Vista we recommend clients to start tracking all three of these metrics to compile a consumer loyalty metric. The customer satisfaction and customer effort questions are both transactional type questions. These should be sent to the consumer in connection with a purchase, return or other type of transaction. Clearly there should be a cadence for these invitations so a consumer would only receive one survey within a three month period for example.
The NPS question is more of a relationship question. Thus it is better sent to the consumer on a scheduled basis such as quarterly. This allows the company to receive feedback though out the year.
That said some retail and CPG companies instead try to bundle all three questions together as they find the response rate to be higher, if the request is close to a transaction. The answer here is to test both approaches and see which gives you the best result.
Interested in learning more about Consumer Loyalty Metric?
Or maybe you would like to see a demonstration of how you can install such a Consumer Loyalty Metric at your company?
If you would like to try a version of this demo survey, you can click here.
At Arbor Vista we have the experience to help you install a successful solution and would be excited to talk with you further. If you have any questions or comments on how this could help your company or one of your clients, please email us by clicking here.